Micro-pattern gaseous detectors applications for imaging purposes, and the prospects of the actual developments
Introduction
Micro-Pattern Gaseous Detectors (MPGDs) are a family of detectors with gas as active medium. They were conceived in order to overcome the limitations of the Multi-Wire Proportional Chambers (MWPCs) [1] with respect to position resolution, their capability to cope with high particle fluxes, and long-term stability. Back in 1988, Oed invented the Micro-Strip Gas Chamber [2], which is considered the first exemplar of the MPGD family. Today, Gaseous Electron Multiplier (GEM) [3] and Micro Mesh Gaseous Structure (Micromegas) [4] are the most commonly used devices. The goal of these structures is to amplify the otherwise small amount of ionisation charge produced in the gas by the interacting particles. All MPGDs have in common production techniques, which rely on photolithographic procedures typical of the Printed Circuit Board manufacturing, and the presence of a dielectric substrate to support the electrodes. In 2008, the establishment of the CERN RD51 Collaboration [5] fostered the coherent and synergistic developments of MPGDs to prove the scalability of the concepts and the industrialisation of the production procedures. Today, MPGDs are sufficiently mature to be widely used in High Energy Physics, as exemplified at the LHC experiments: ATLAS [6], CMS [7] and ALICE [8] upgrades foresee their use.
Imaging with MPGDs
In recent years, these devices found applications beyond High Energy Physics mainly due to their imaging capabilities. Some examples that do not exhaust the list of applications are:
- The developments to obtain a radiation-hard detector based on GEMs for imaging and dosimetry applications during gamma-ray treatments [9].
- GEMs have been used for X-ray fluorescence of artworks in order to unveil underlying paintings over large surfaces [10].
- A portable and battery-driven muon telescope based on Micromegas is used for cosmic muon tomography [11], presently scanning the Egyptian Pyramids.
All these devices typically have the signals read out electronically. This means that each channel has its own amplification and digitisation chain. Despite being unavoidable in some occasions, an alternative to this approach exists: the so-called optical readout. Scintillation light produced during the amplification avalanche can be detected, making the gaseous detector a scintillating plate with extraordinary light yield. The first ideas of taking pictures of scintillating gases go back to the beginning of the ’80. For instance, Charpak and collaborators used an image intensifier camera to photograph a parallel plate avalanche detector filled with Ar/CH4/TEA [12]. The choice of the gas mixture was mainly driven by the scintillation spectrum. Unfortunately, not many gases scintillate in the visible window, for which most of the light sensors are optimised. CF4 is one of them, and the mixture of Ar/CF4 80/20 emits orange light in a broad peak around 630 nm. Modern MPGDs coupled with modern cameras are very promising tools to deliver fast and good quality images. R&D in this direction already exists [13, 14, 15, 16], and this technique will certainly be exploited much more in the future.
Optical readout
In the Gaseous Detector Development laboratory at CERN an optically read out triple GEM detector was built. The scheme and a picture of the device are shown below.
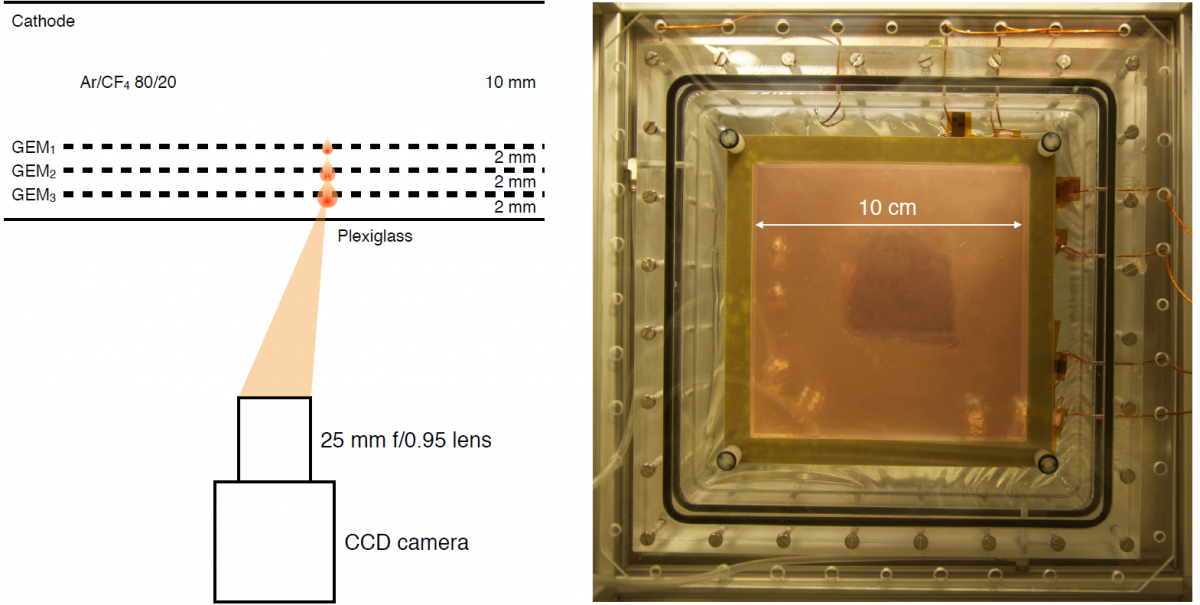
Fig. 1: Scheme of the detector and picture of the detector from the position of the camera.
The triple GEM guarantees large amplification, and therefore large amount of scintillating light. The camera, focussed on the last amplification stage, records a small fraction of the produced light due to geometrical acceptance, but still large enough to detect the signals of few primary electrons. In fact, at a charge amplification of 10^5, the light yield is of the order of 10^6 ph/keV, huge compared to 40 ph/keV typical of a very common scintillator like NaI(Tl).
Some example applications
The next figure shows two X-ray radiographies of the same dead mammal, a bat. The one on the left was taken with a triple GEM detector read out electronically, the other is actually the photograph of the scintillating GEM detector. Very similar quality is achieved with much less effort in the latter case: this image was obtained with less than a second exposure, and with no post-processing. It is displayed as it comes out from the camera.
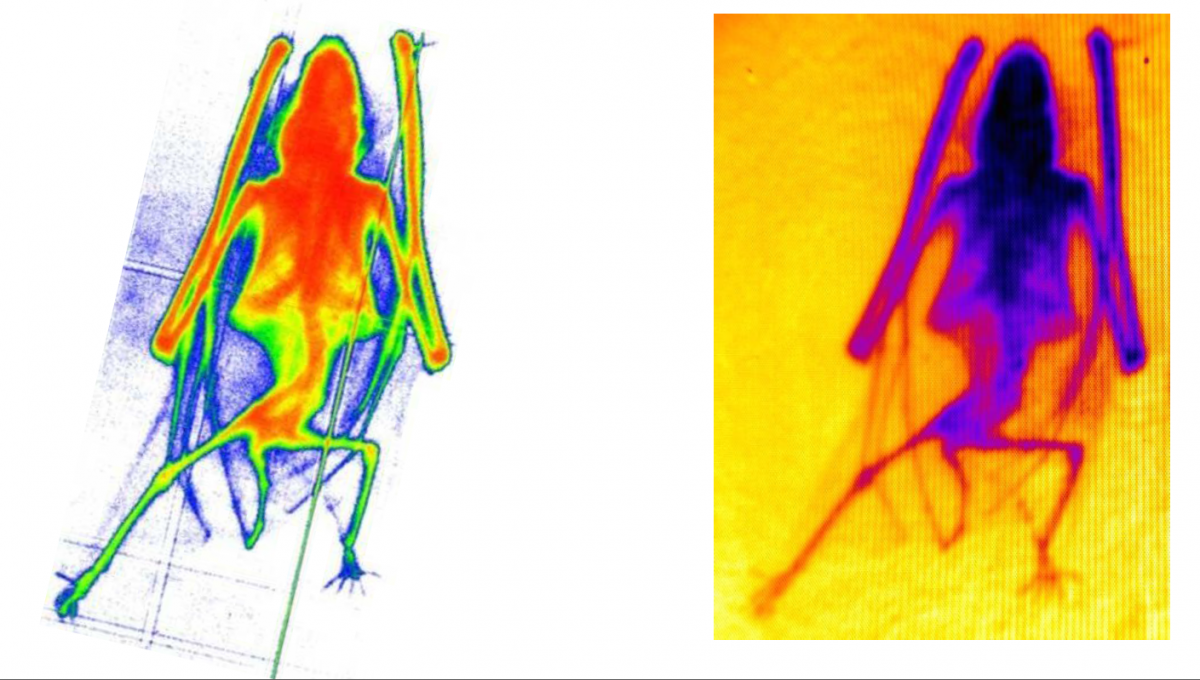
Fig 2: Radiography of the same bat with triple GEM detector electronically (left) and optically (right) read out.
A small toy quadcopter is an object more enjoyable to radiograph: it actually flies. The movie below shows the first flight of the drone in front of the detector illuminated by an X-ray beam, a technique that clinically is called fluoroscopy. This movie is not intended to show the skills of the pilot, but is the proof of the simplicity and robustness of the acquisition.
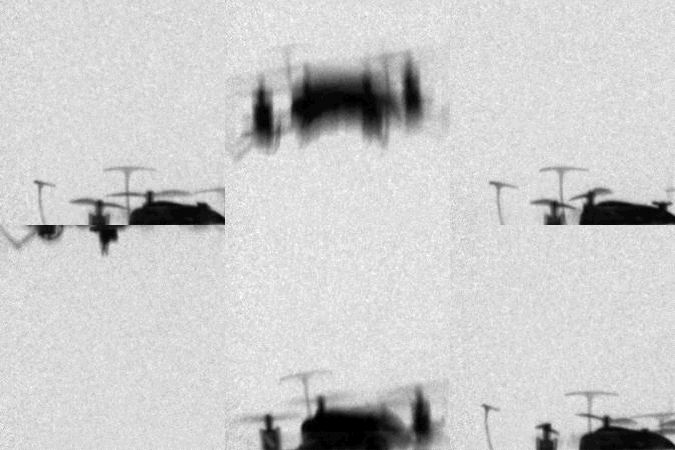
Fig. 3: Fluoroscopy of a flying drone.
By taking radiographies of an object at different angles it is possible to reconstruct it three-dimensionally. The sinograms are obtained from the raw images, and the 3D model derives from applying a filtered back projection, typical of Computer Tomography. Again, the detector delivers good quality images that can be immediately used with minimal post-processing treatment.


Fig. 4: Series of radiography of a squashed plastic glass containing two pens (left) used to reconstruct the object three-dimensionally (right).
Single ionising events can be detected decreasing the exposure time and increasing the gain of the GEMs. The images below display some examples:
- Two tracks from highly ionising alpha particles from the decay of 220Rn and its daughter 216Po.
- Low but localised energy released by X-rays from a 55Fe source.
- Shower development from a charged pion interacting in an iron brick just outside of the detector.
- Minimum ionising muon with a long delta ray.
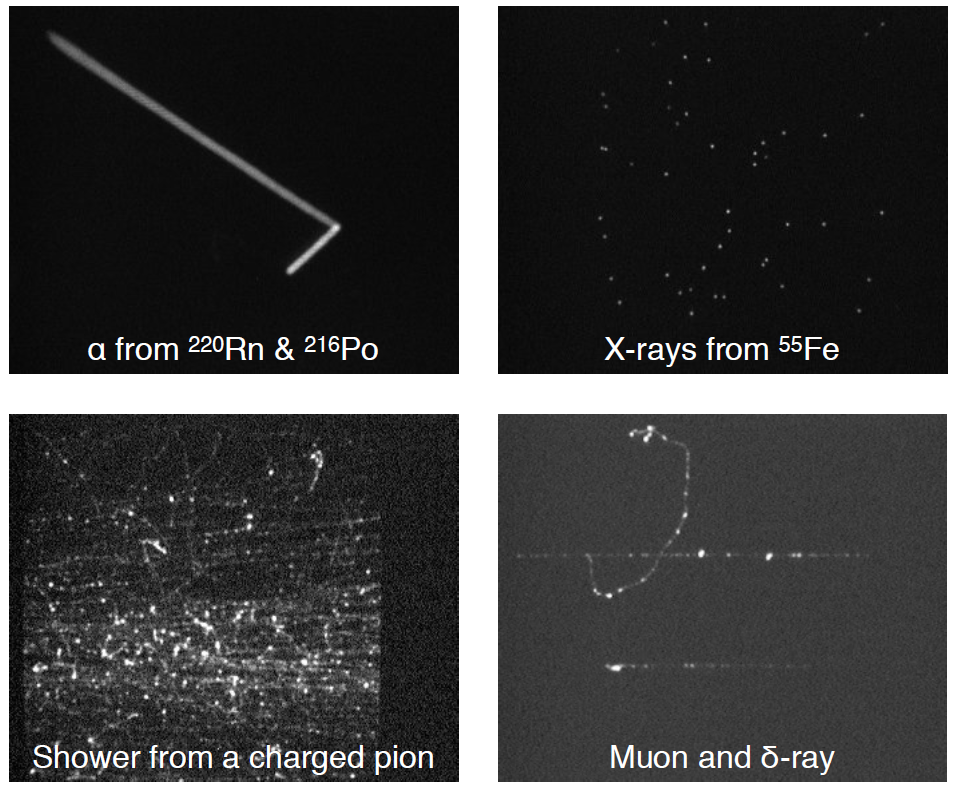
Fig. 5: Sample images of different ionising events.
The topology of these events is already very instructive. Moreover, the images contain quantitative information: the grey scale is proportional to the local energy release. As an example, the energy of the 5.9 keV X-ray from the 55Fe source can be estimated with a resolution better than 25% FWHM, as shown in this figure.
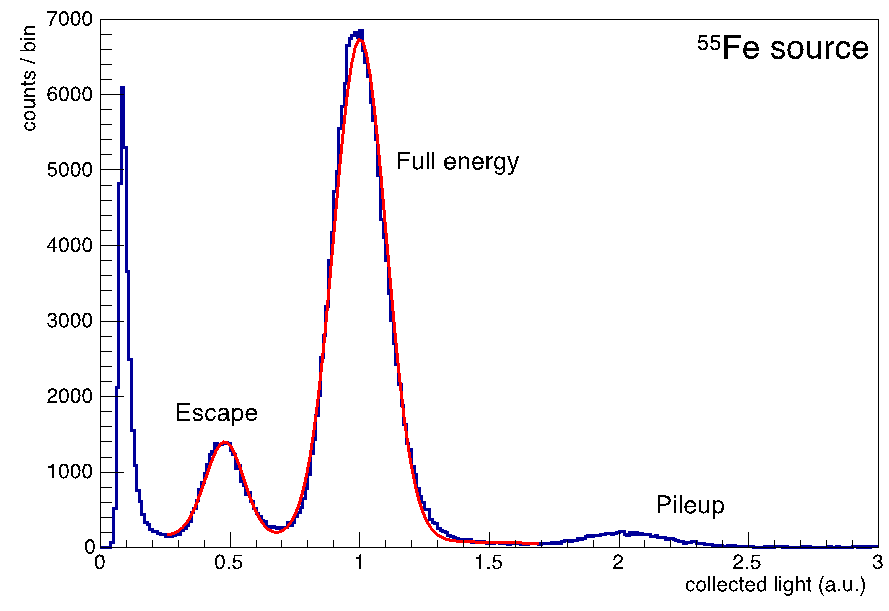
Fig. 6: Distribution of the light collected by the camera when exposing the detector to a 55Fe source.
This capability can be used to perform (in few minutes) a position and energy resolved X-ray fluorescence of an extended object. The target, illuminated with an X-ray beam, is the collection of metals shown below in the image on the left. The characteristic X-rays from each metal pass through a pin-hole before reaching the detector: the spatial information is traded with acquisition time. Energy and position are measured for each interacting X-ray. Translating the measured energy into a colour scale, the resulting fluorescence image is shown in colours.
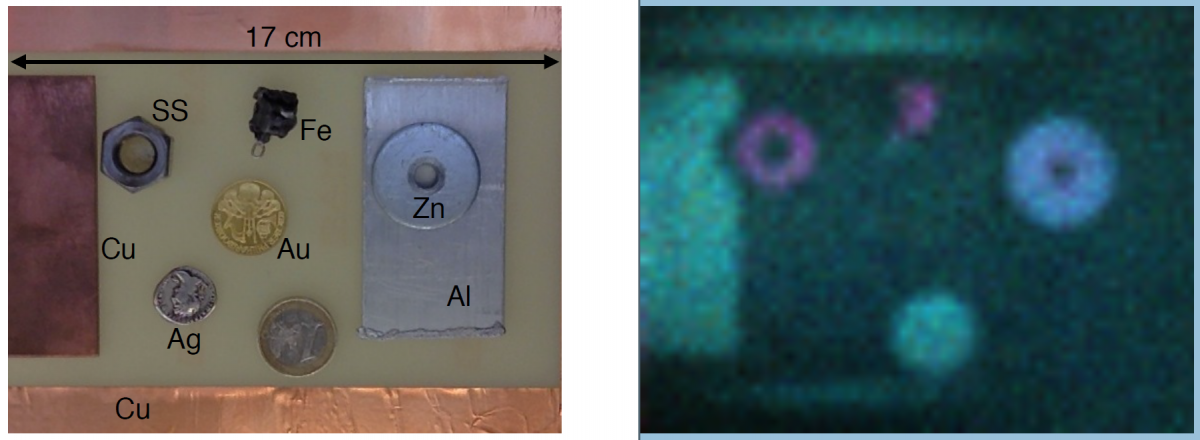
Fig. 7: Picture (left) and X-ray fluorescence image (right) of a collection of metals.
Different materials, having characteristic emission spectra, have characteristic colours: copper-rich in green, iron-rich in pink, and zinc-rich in blue. With the same colour code, the characteristic spectra are shown in the histogram below.
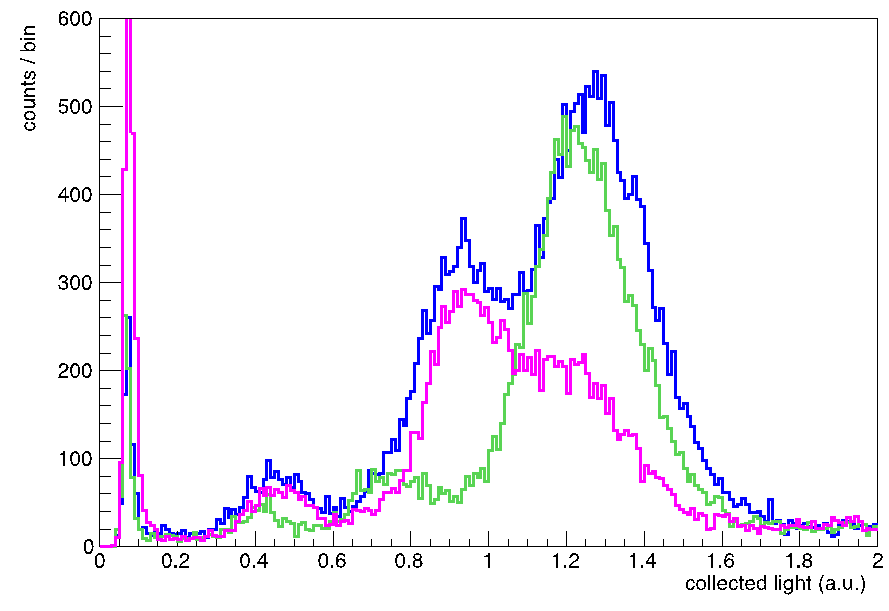
Fig. 8: Collected light spectra from the X-ray fluorescence for different materials.
Conclusions
What is highlighted in this article is a round up of possible usage of the optical readout, a versatile, intuitive and simple technique for imaging with MPGDs. More information can be found in [17]. Keeping in mind that the prototype detector was not optimised for any of the measurement performed, one can imagine several other applications, ranging from X-ray crystallography over large areas, online beam monitor in hadron therapy treatments, rare events searches with Time Projection Chambers, and possibly several others.
Bibliography
[1] G. Charpak et al., Nucl. Instrum. Methods 62 (1968) 262.
[2] A. Oed, Nucl. Instrum. Methods A263 (1988) 351.
[3] F. Sauli, Nucl. Instrum. Methods A386 (1997) 531.
[4] Y. Giomataris, Nucl. Instrum. Methods A376 (1996) 29.
[5] http://cern.ch/rd51-public/
[6] ATLAS Collaboration, ATLAS-TDR-020, CERN-LHCC-2013-006.
[7] CMS Collaboration, CMS-TDR-015-02, CERN-LHCC-2015-010.
[8] ALICE Collaboration, ALICE-TDR-016, CERN-LHCC-2013-020.
[9] http://c-rad.se/product/gemini/
[10] A. Zielińska et al., 2013 JINST 8 P10011.
[11] https://indico.cern.ch/event/451078/contributions/1113856/attachments/11...
[12] G. Charpak et al., Nucl. Instrum. Methods A258 (1987) 177.
[13] https://agenda.infn.it/getFile.py/access?contribId=4&sessionId=2&resId=0...
[14] S. Ahlen et al., Phys. Lett. B 695 (2011) 124.
[15] N. S. Phan et al., arXiv:1510.02170/
[16] M. Marafini et al., Nucl. Instrum. Methods A824 (2016) 562.
[17] https://indico.cern.ch/event/521993/
